myAudit — inspect measurement requests in real time
myAudit shows the measurement requests from your own test device in real time: which requests arrive, with which page code, and which category that code is mapped to. It lets you verify an integration before go-live without working through log files.
You can test websites and native or hybrid apps (iOS, Android).
New: both measurement methods in one test. The consent-free census measurement (IOMb) and the pseudonymous measurement (IOMp) run in the same session and the same list — one page view tells you whether both are working, and the Type filter switches between them. Until now myAudit covered only the census measurement; the pseudonymous one needed a second tool.
Quick guide — the whole procedure at a glance
Start a session → connect the device → test → inspect → clean up.
- Start a session — in the portal under MyAudit, click Start MyAudit test and wait 1–2 minutes.
- Connect the device — scan the QR code from the Connect your device card in WireGuard and switch the tunnel on. On a desktop, import the file from Download .conf instead.
- Test — open the page, or use the app.
- Inspect — in the list, set the Type filter to All and check Site, Code, Category and Domain per request. IOMp appears after consent.
- Clean up — switch the tunnel off, or set DNS back to automatic, and then stop the session.
The session ends by itself — after 3 hours at the latest, and already after 30 minutes in which no request arrives. The setting on the device has to be reverted then too.
How the marking works
What is marked is not the individual request but the route: you send your test device's measurement calls through a test proxy that you start yourself in the portal. Our measurement systems recognise it by its IP address and attribute every call arriving that way to your session — identically for both measurement methods.
Nothing is decrypted on the way: on the DNS route, TLS connections are passed through by hostname (SNI passthrough, the certificate comes from the target system); in the tunnel, packets are forwarded unchanged.
Test calls are counted
The marking marks the route; it does not take the request out of the measurement: your test calls are processed normally and appear in your figures and in the audited results. Ordinary testing does not move the needle; with extensive automated test runs the contribution can become visible.
Check first
- The measurement has to be live. The test proxy only knows measurement domains whose certificate has already been issued and is active. A measurement domain you have just created, whose CNAME does not resolve yet, is invisible to myAudit — see setting up the measurement domain.
- Know your offering identifier (
st), otherwise you will not recognise your own rows. What the parameters mean: parameter reference. - IOMp requests exist only if the pseudonymous measurement is built in.
- A device whose network settings you are allowed to change, on a network that lets the necessary traffic out: outbound UDP 51820 for the tunnel, outbound port 53 for the DNS route. On managed company devices you often are not allowed to; a forced corporate resolver, or a pinned "Private DNS" on Android, prevents capture without showing an error.
1. Start a session
In the portal, go to MyAudit and click Start MyAudit test. Provisioning takes 1–2 minutes, after which the session shows you how to connect your test device.
- One session per user at a time. If one is still running, stop it first.
- If the session shows status Failed, click Retry — that sets the same session up again, you do not need to start a second one. That status only appears after several automatic attempts, which can take a few minutes. The session names the cause in plain words; the technical message sits below it behind Technical details, and that is what we need if you ask us about it (see below).
- If the portal reports that all test proxies are in use, try again in a few minutes.
- The session stops automatically: after 3 hours at the latest — and already after 30 minutes in which no request arrives. Those 30 minutes run from the start of the session and restart with every captured request, so set your test device up promptly. You can stop it earlier at any time.
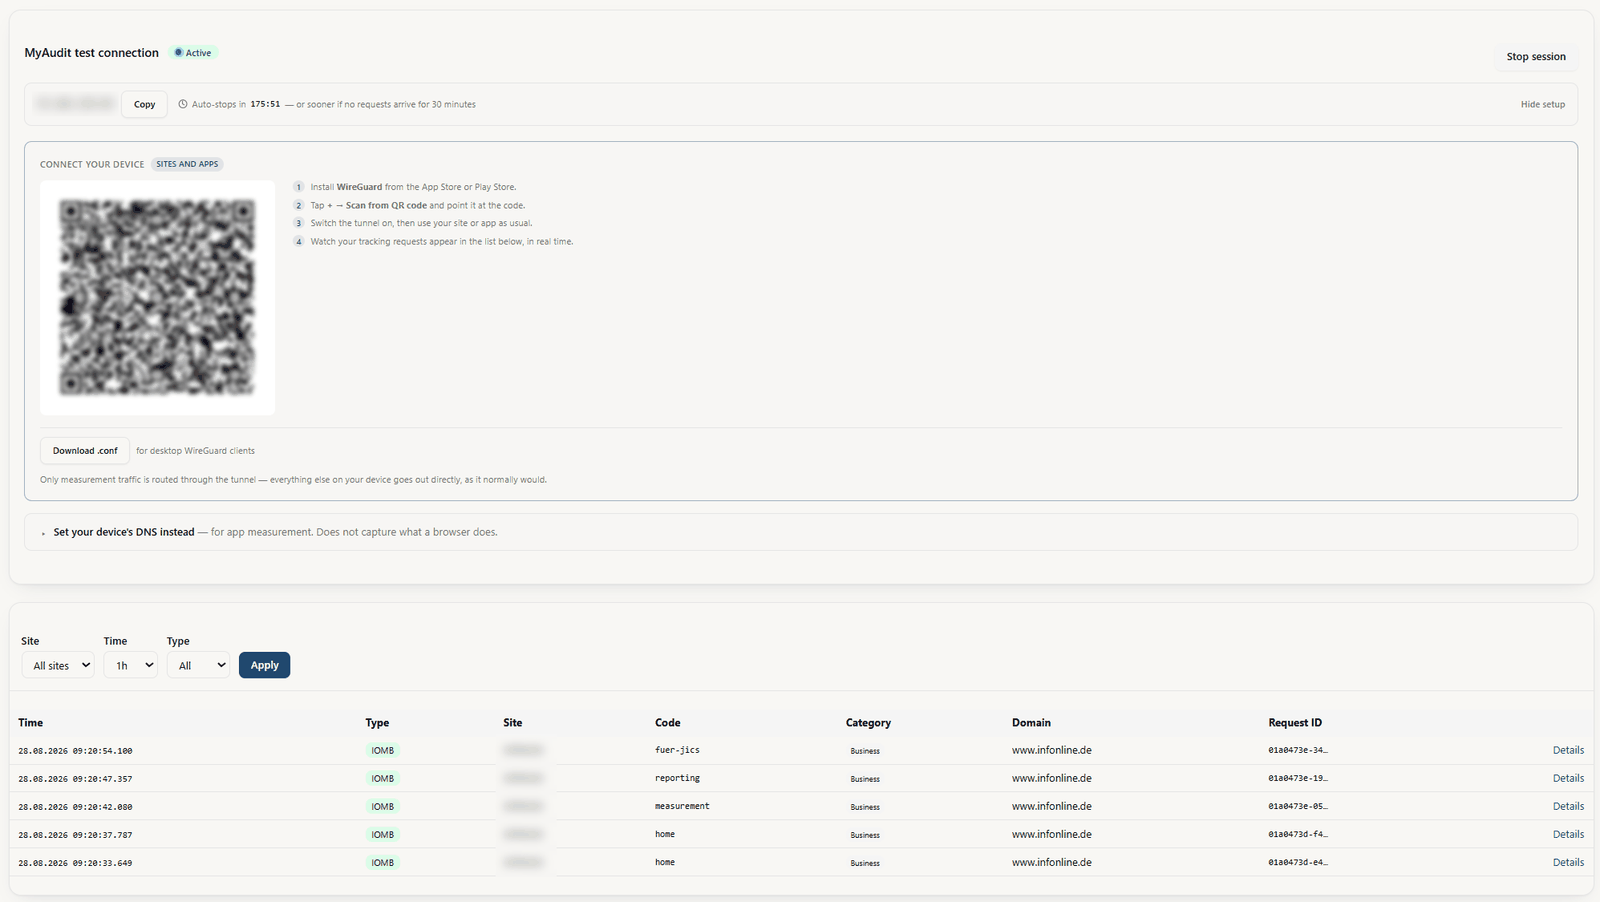
Address, offering identifier and QR code are blurred in the screenshot — your own session shows your values there.
2. Connect your test device
The session leads with the Connect your device card: the QR code for the VPN tunnel, the steps, and the Download .conf button. The tunnel is the route for everything — websites as well as apps, desktop as well as mobile. Below it, collapsed, sits Set your device's DNS instead: the DNS address is the fallback for when the tunnel is not an option.
| What you are testing | Route |
|---|---|
| Everything — websites and apps, desktop and mobile | VPN tunnel, the Connect your device card |
| Only when the tunnel is not an option: WireGuard cannot be installed, the network blocks UDP 51820, or the session offers no tunnel | DNS address, expandable under Set your device's DNS instead — captures apps; websites only with DoH turned off |
Why the recommendation: the DNS route is a redirection, and it depends on the device actually asking us for the hostname. Already cached names, open connections and applications with their own resolver bypass it. The tunnel operates below name resolution, does not have that problem, and also captures HTTP/3.
On Android the DNS route does not work — not for apps either
Android does not hold on to a manual DNS setting: it hangs off the Wi-Fi's static IP configuration and is lost on a reboot, an airplane-mode toggle or a "forget network". Capture then ends mid-test without an error message — and that hits native apps just as it hits the mobile browser. With "Private DNS" set on top, the test proxy is never asked at all.
On Android, use the tunnel. On iOS the manual DNS setting stays stable, as it does on a Windows or macOS machine — there the DNS route is usable as a fallback.
Recommended: VPN tunnel
In the session, the QR code is right there in the Connect your device card, with a Download .conf button below it for desktop machines. There is nothing to request.
Only traffic to our measurement endpoints is routed through the tunnel; everything else on the device goes out directly.
- Install the free WireGuard app (Android, iOS, Windows, macOS).
- In WireGuard, tap + or Add tunnel and choose Scan from QR code.
- Scan the QR code from the session, give the tunnel a name (anything, e.g.
myAudit-Test) and create it. On a desktop, import the file from Download .conf instead. - Switch the tunnel on and check the connection: tap the tunnel — the counters under Transfer increase and there is a successful latest handshake. If the handshake never happens, your network is probably blocking outbound UDP port 51820 — test from a different network, for example over the device's mobile data.
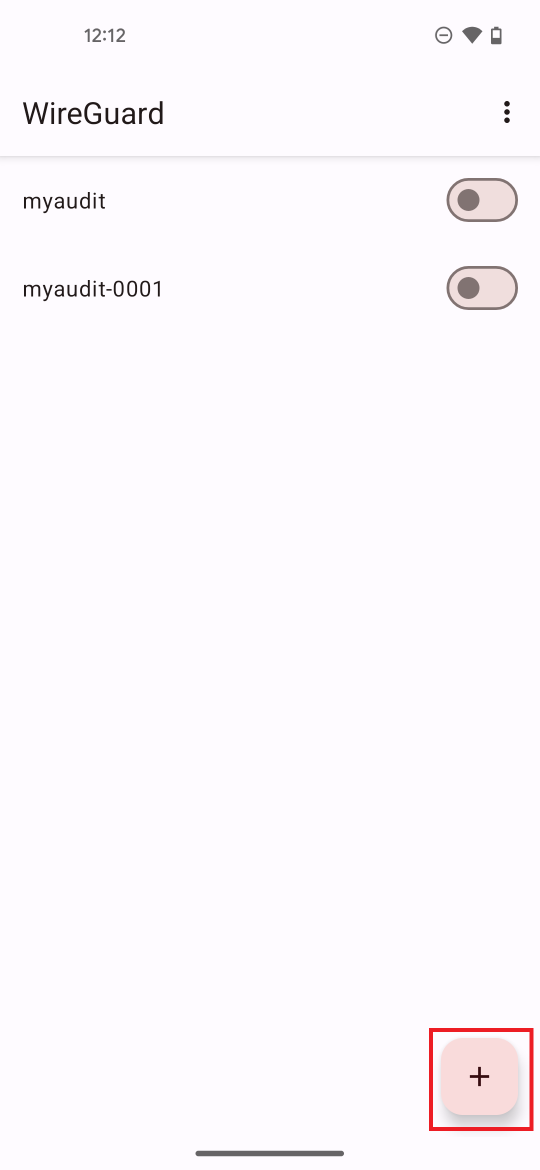
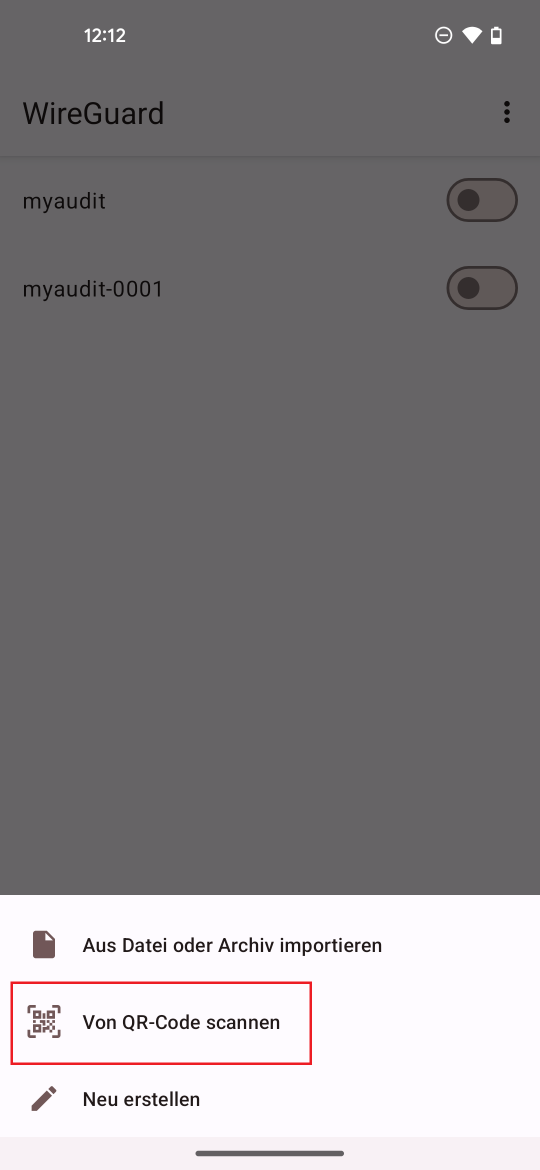
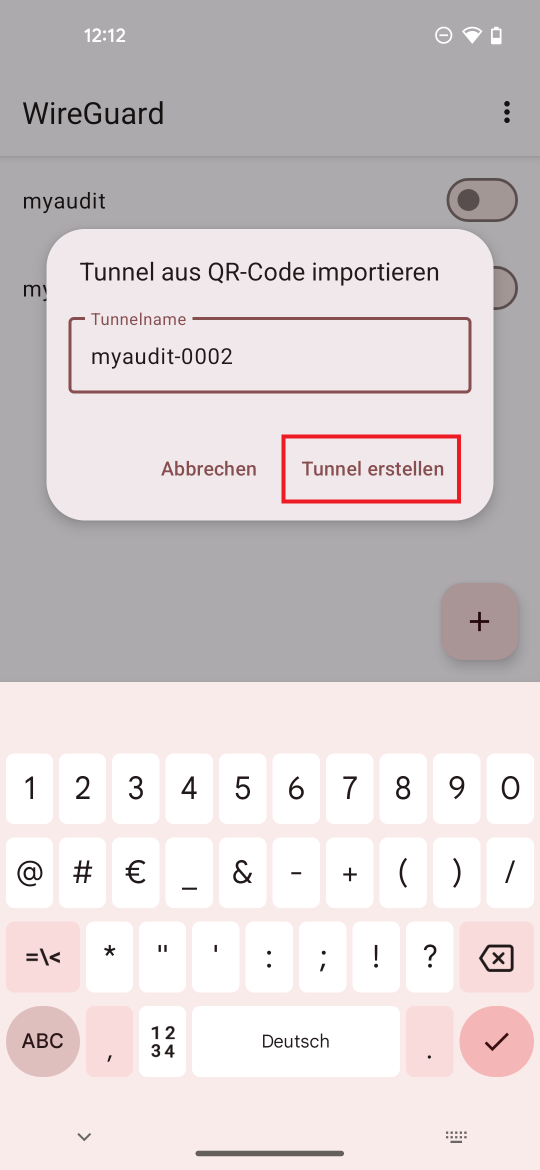
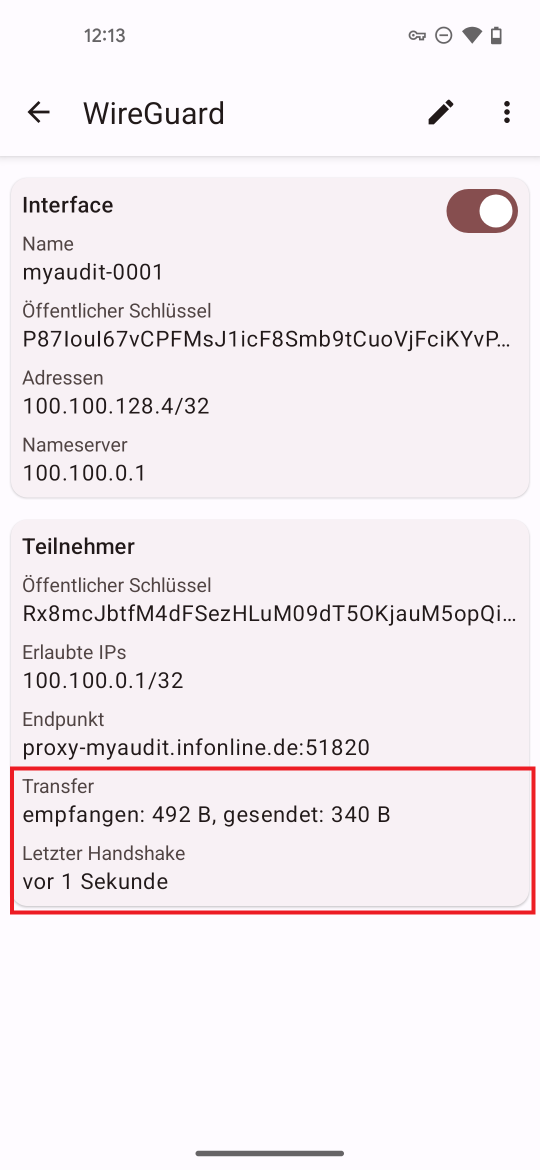
The screenshots show Android; on iOS the steps are named the same. After a device reboot the tunnel is usually off — check the handshake again before concluding that the measurement is broken.
No tunnel in your session?
If your session reports "The VPN tunnel isn't available for this session", only the DNS route is set up for it — it is then shown expanded. Stop the session and start a new one a few minutes later; if it stays that way, contact support@infonline.de.
Fallback: DNS address
For when the tunnel is not an option — and not for Android (see above). In the session, expand Set your device's DNS instead: it holds a DNS server address (IPv4, with a copy button) and, under How to set your DNS on each platform, the path for each platform. Set that address as the DNS server on your test device and replace any existing entries — a second DNS server of your own next to it means part of the calls bypass the proxy and the list stays empty although everything looks correctly set up.
For websites this route only captures if you turn off encrypted DNS (DoH) in the browser — otherwise the browser asks its own resolver, the test proxy never sees the calls, and the page loads normally all the same. The DNS route is reliable for apps, which use the system resolver.
One thing only this route can do: check a measurement hostname before public DNS points at the new measurement infrastructure. That is why it stays.
| Platform | Path |
|---|---|
| macOS | System Settings → Network → your connection → Details → DNS |
| Windows | Settings → Network & internet → your adapter → DNS server assignment → Manual |
| iOS | Settings → Wi-Fi → ⓘ → Configure DNS → Manual |
| Android | Wi-Fi → modify network → IP settings: Static → DNS 1 (leave the pre-filled IP, gateway and prefix as they are) |
Leave the second DNS field empty, turn encrypted DNS off for the duration of the test (DoH / "Secure DNS" in Chrome and Firefox, iCloud Private Relay), and restart the browser before you open the test page — otherwise it uses a cached name and never asks the proxy.
What this does to your device
While that address is set, all of the device's name lookups run through the test proxy, not only those of the site you are measuring. Two consequences: company-internal names (intranet, AD, printers) will not resolve any more, because the proxy only knows public resolvers; and both the name lookups and the connections routed through the proxy are logged there so we can support you if something goes wrong — those logs are deleted together with the proxy. On a device that needs access to your company network, use the tunnel.
3. Inspect the requests
Open the page you want to test, or use your app. The requests usually appear in the list within seconds.
The session itself tells you whether it can hear your device: until something arrives it reads Waiting for the first request from your device…, and with the first captured request it switches to Capture confirmed ✓ together with the age of the most recent one. That is the first place to look — it confirms the measurement, whereas the counters in the WireGuard app only confirm the tunnel.
The filter bar has the fields Site, Time (1 h, 6 h, 24 h, 7 d) and Type (IOMB, IOMP, All) —
applied with Apply. What is shown are the requests from your own session. In the table, your offering identifier
(st) is in the Site column, the page code (cp) in Code, and the mapping derived from it in
Category.
What to check:
- Does one census request arrive per page view?
- Does Code show your page code — and not
Leercode_nichtzuordnungsfaehig? That value means no code was passed: the request is measured, but nothing can be attributed. - Does the category in Category match what the code is supposed to mean? A "—" means this code is not mapped yet.
- Is the domain in Domain the expected one? This is where calls arriving under a foreign host show up, for example via an AMP cache or a proxy.
- Do IOMp requests appear after consent? They normally do only then; seeing only IOMB before that is correct.
The user agent is deliberately not shown in the IOMb detail view.
Requests are kept for 7 days and then deleted automatically. That applies to the myAudit view, not to your measurement data.
The list stays empty — check in this order
Read the message in the session first. It now names the case that applies — among them "requests were captured, but all of them for sites you don't have access to" (switch organization) — and it tells the tunnel and DNS routes apart: on the tunnel an empty list is a finding, on the DNS route it is inconclusive, because a page that has already loaded does not ask again.
- Are you even looking at the right offering? Requests only appear for offerings that belong to your account — a call with a foreign or missing offering identifier is captured but not displayed. This is the most common reason for an empty list with the marking set up correctly.
- Is the marking active? DNS address still set, or tunnel switched on (handshake present)?
- On the DNS route: browser restarted, encrypted DNS off, no second DNS server entered? On an Android device the setting may already have been dropped — there, only the tunnel gets you there reliably.
- For apps: is the library initialised and consent set? The library's debug mode helps as well — iOS, Android.
- For websites: does the measurement load at all? The order to check that in is under nothing arrives.
4. Finish the test
The device first, then the session:
- Switch the tunnel off, or set the device's DNS server back to automatic.
- Stop the session in the portal.
The other way round leaves your device without working name resolution — the proxy's address is released when the session ends and can later be assigned to someone else.
The same applies when the session ends by itself — except that it announces it. Roughly five minutes before, the session shows a notice, and it says different things depending on the reason: if the lifetime is running out it tells you to wrap up; if it is the half hour without a request, it tells you that a single call keeps the session alive. Once the deadline has passed it says the session is being stopped now — taking the proxy down takes a few minutes more.
The notice then stays up and says what to revert on the device: switch the tunnel off in tunnel mode, set the DNS server back to automatic in DNS mode. Do not rely on watching it happen, though — the DNS route runs into the half hour easily, and if the DNS address is still set on the device afterwards, no name resolution works there at all. It looks as if the internet is broken, and that is the first thing to check when a test device suddenly cannot reach anything.
Notes
Consent to data processing
By marking your device you consent to the processing of the calls it generates. On the DNS route, all of the device's name lookups are logged as well — on a company device, please clear that internally first. To stop the processing, remove the marking.
If it does not work: what we need
Write to support@infonline.de and include: the address from your session, the date and time of the test, which route you used (DNS or tunnel), the status of the last handshake if you used the tunnel, and the error text shown if the session failed.
Measurement hosts that cannot be tested
The test proxy only knows measurement hosts served through our cloud ingress systems. Hosts that have not been migrated there yet, and hosts of offerings that run the service platform themselves, cannot be tested at the moment — myAudit does not see those calls. Contact support@infonline.de in those cases.
What changed compared to the previous version
The former procedure — generate a token in the Kunden Center, append it to the user agent, request a QR code
from support by e-mail, log in separately at myaudit.infonline.de — is gone. You start the session yourself
in the portal; there is no token, no second login and no e-mail to support. Handing over a certificate and
private key for self-hosting is no longer necessary either: the proxy decrypts nothing. And myAudit now covers
both measurement methods — previously only the census measurement.